Power BI Dashboard Exercise
I self-learned PowerBI in this summer break. For illustration purpose, I would show the static dashboard which I have created base on the speed-dating dataset from the machine learning final assignment in Python.
With an investigation objective in mind, PowerBI is useful in generating a 1-page dashboard to convey the most essential information from the dataset to the audience concisely.
Our objective is to explore the associations of 4 key descriptive attributes (age, gender, race and attractiveness) with the target event (positive ‘match’ which denotes the participant would like to see their date again). The following dashboard would fulfill the purpose:
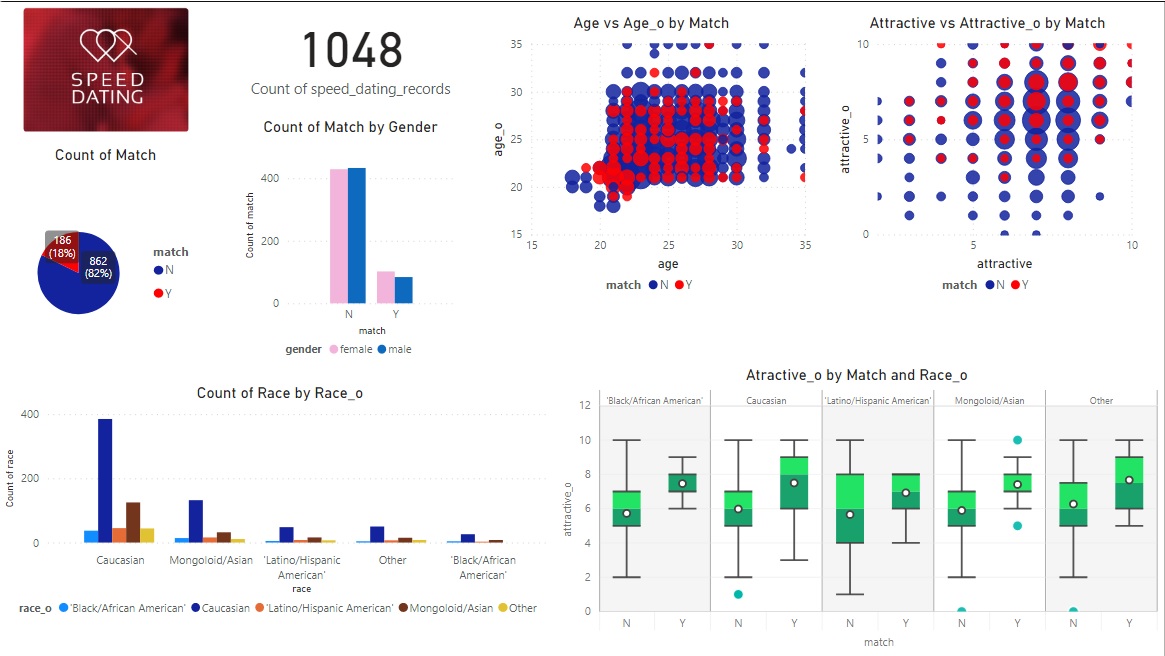
N.B. Age, race, attractive denote the age, race and self-rated attractiveness of the participant in the speed-dating events. Age_o, race_o denote the age, race of the partner of the corresponding participant, attractive_o refers to rating on attractiveness by partner about the participant at the night of event.